Execution
The Execution page lists all routes of the active configuration. From here you can switch each route's automatic triggering on or off and start a run manually — independent of the route's configured trigger. Completed and running operations themselves are shown in History.
Permissions
The page is visible once you have the Operations — Execution permission (Read or Full). Without the Full permission level, the automation switch is visible but disabled, and the detail view's Start run and Transfer individually actions, as well as Decide above a suspended cleanup, are unavailable.
List view
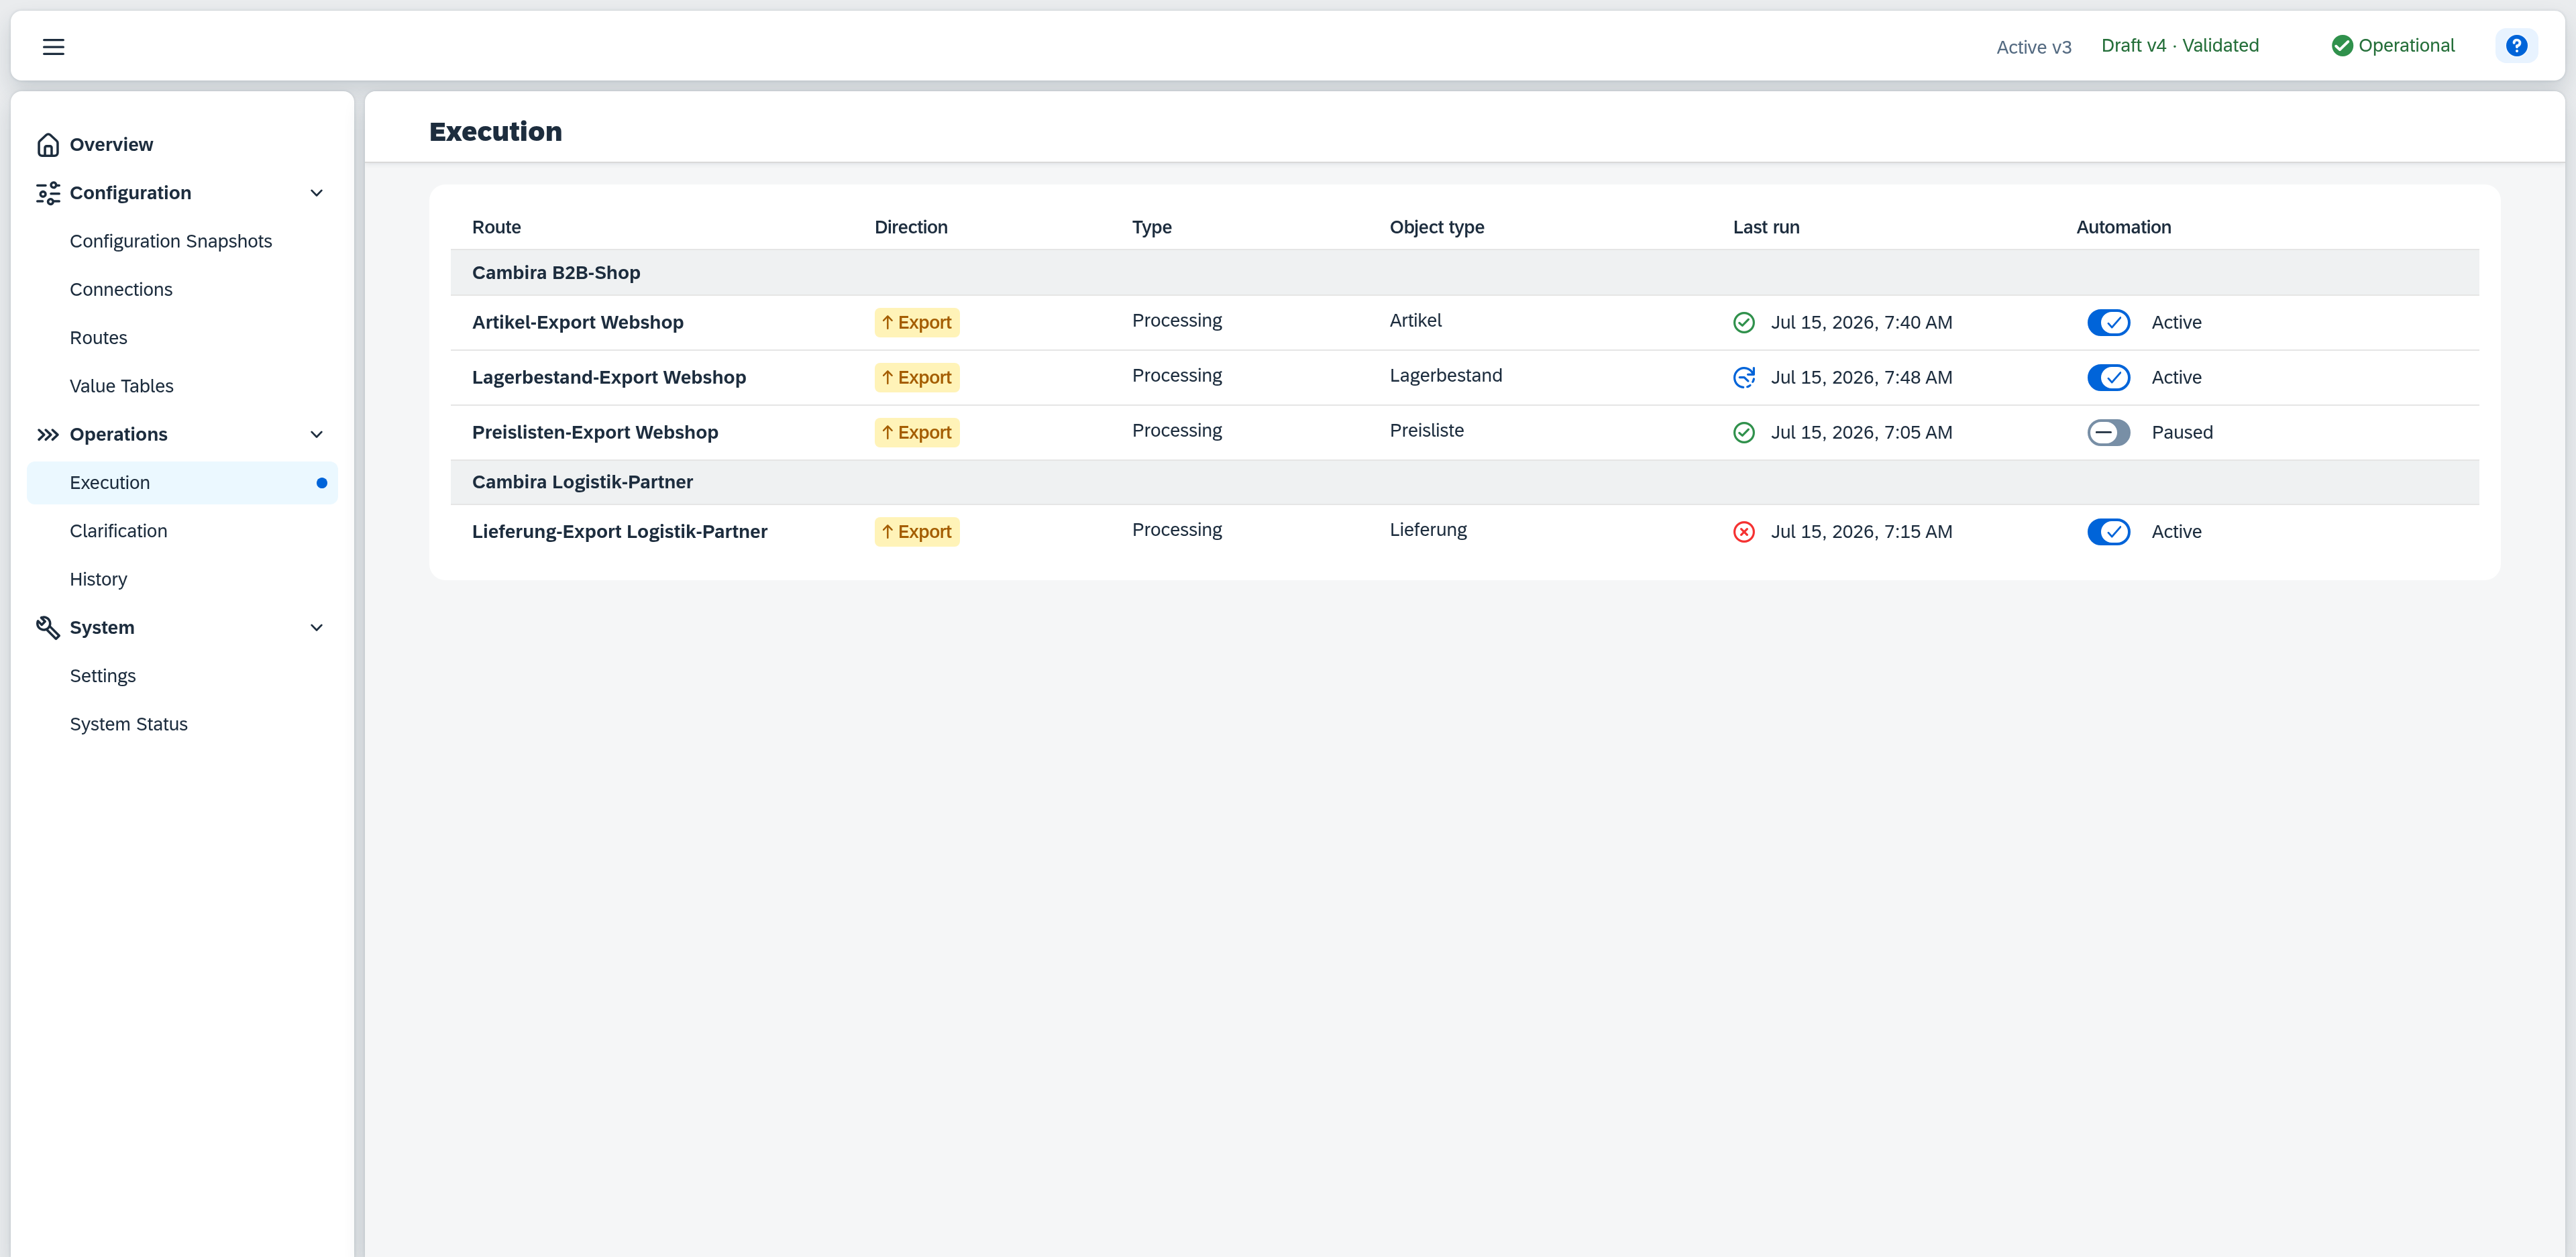
The list shows all routes of the active configuration, grouped by connection — the group header names the connection. Within a group the routes are ordered by direction and type, then by object type and finally by name, exactly as in the Routes list. Clicking a row opens the detail view on the right.
Columns
| Column | Content |
|---|---|
| Route | Display name of the route. |
| Direction | Data flow direction as a coloured tag — e.g. Export (data leaves Xchange). |
| Type | Route type, which determines the processing pattern — Processing or Dispatch. |
| Object type | The business object type the route processes, e.g. Artikel. |
| Last run | Timestamp of the route's last run, with an icon for its outcome — see status values below. Shows "—" if the route has never run. |
| Automation | Switch for this route's automatic triggering, with the text Active or Paused — see automation switch below. If the route's connection is unavailable, a tag sits below it: orange Connection blocked when the connection failed to authenticate, blue Connection paused when it was paused deliberately. Both override the switch — the route does not run even at Active. |
The connection is not shown as its own column but as the group heading (see above).
Status values (last run)
| Status | Colour | Meaning |
|---|---|---|
| Succeeded | green | The last run completed successfully. |
| Failed | red | The last run failed permanently. |
| Configuration not runnable | red | The last run could not execute because of a configuration error on the route. Shown with the same red icon as Failed; the exact reason is in the icon's tooltip. |
| Partially succeeded | orange | The last run processed only part of the records successfully. The exact reason is in the icon's tooltip. |
| Conflict | orange | At least one record of the run was changed in the target system in parallel; the decision is yours. |
| Cleanup suspended | orange | The run did not carry out its cleanup because it would have reported a conspicuously large share of the data set; it is waiting for your decision. |
| Running | blue | The last run is currently executing. |
| Pending | grey | The last run is still waiting to be processed. |
| Skipped | grey | The run read its data set and found nothing to do in it. |
| Cleanup declined | grey | A suspended cleanup was discarded; nothing went to the target system. The next full run with a cleanup determines the records afresh. |
| Not started (another run active) | grey | The run read nothing at all: another run for the same route was still active. |
If no configuration is active, the list shows an illustration prompting you to activate a configuration first. If the active configuration contains no routes, it instead prompts you to configure a route under Configuration → Routes first. If the Service Layer is unreachable, it reads "Data not available"; if loading fails for another reason, "Loading failed" with the cause as the description.
Automation switch
The switch in the Automation column determines whether a route is triggered automatically by its configured trigger (Active) or not (Paused). This is a separate, runtime-level state — independent of whether the route itself is configured and part of the active configuration in Routes. A newly created route is Paused by default here and must be deliberately activated before its trigger takes effect.
Toggling takes effect immediately — with one exception: pausing a Dispatch route that dispatches to configured target routes first shows a confirmation, noting that those target routes will no longer be supplied until the route is resumed. If toggling fails technically, the switch reverts to its previous state and a message states the reason. The same happens if you toggle again while the previous change is still being applied: the switch reverts and reports "The previous change is still being applied" — wait a moment, then toggle again.
The route's connection takes precedence over the switch. If it is blocked or paused, the corresponding tag (Connection blocked or Connection paused) sits below the switch and the route does not run even at Active — the switch itself stays operable and keeps its state for the moment the connection becomes available again.
The manual Transfer individually action (see Actions below) is independent of this switch: a targeted transfer is possible even while a route's automation is paused.
Detail view
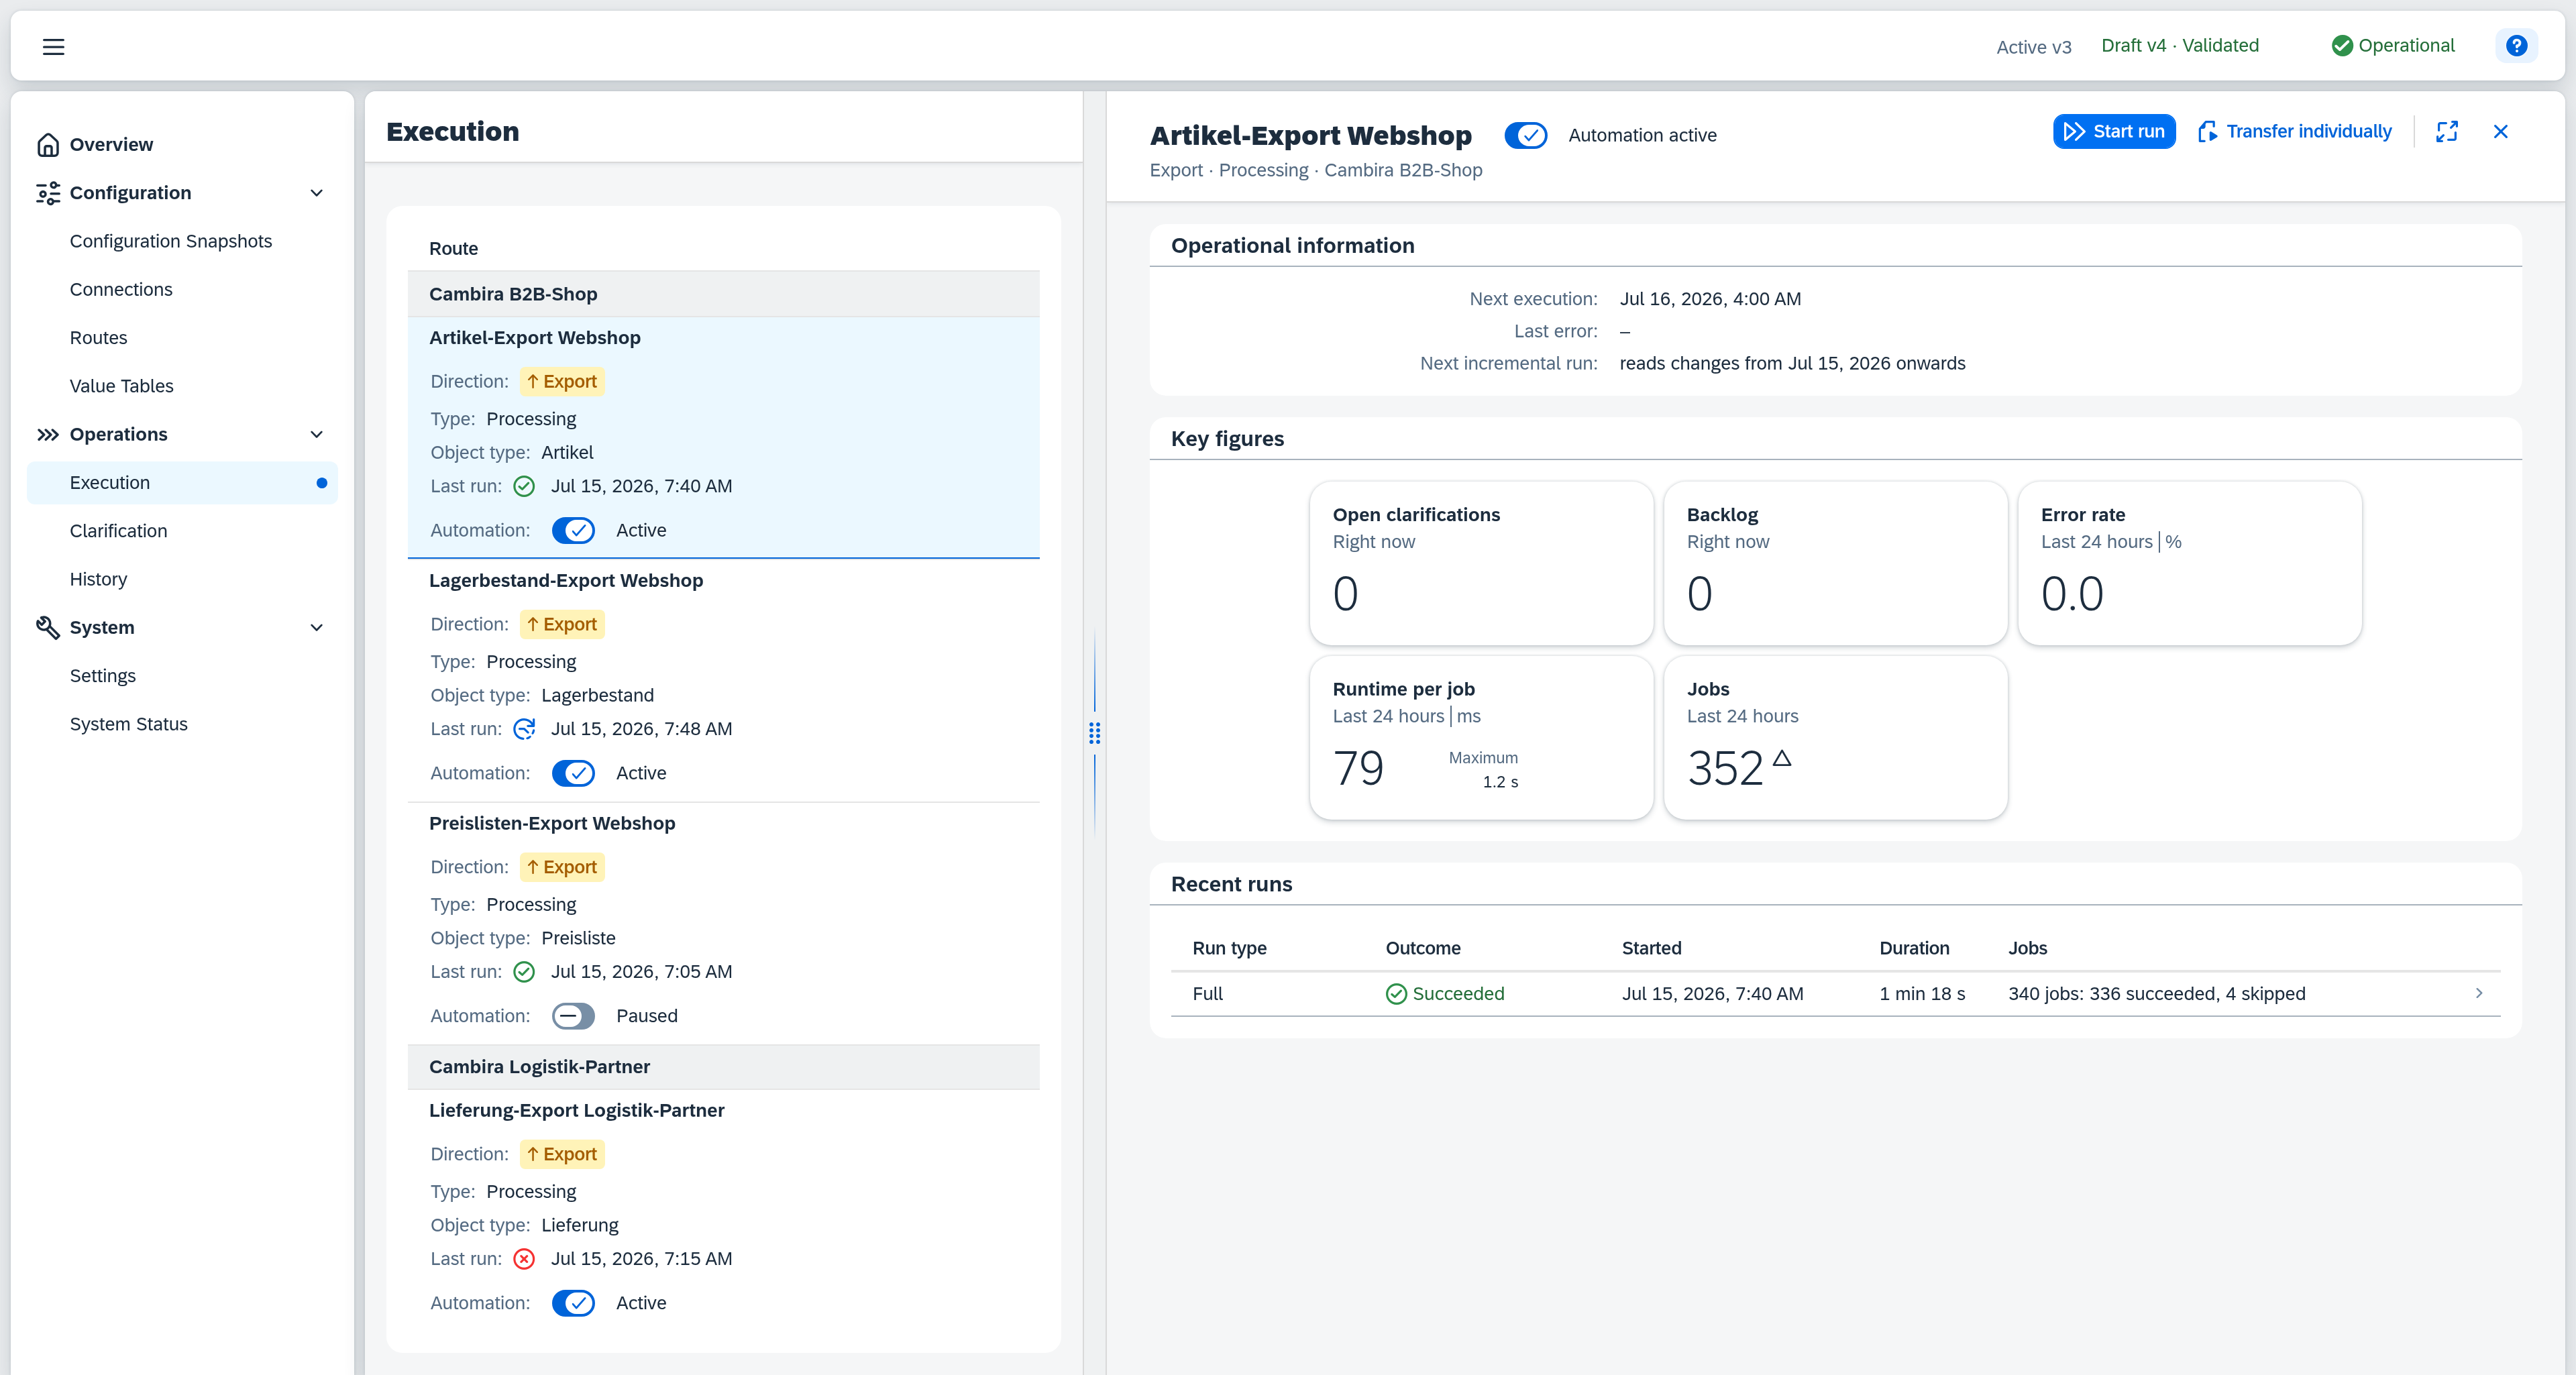
Clicking a row opens the detail view on the right with the actions for the selected route. If no route is selected, the detail view shows a placeholder prompting you to select a route from the list.
Header
| Field | Content |
|---|---|
| Title | Display name of the route. |
| Automation | Beside the title sits the state of automatic triggering — Automation active, or in orange with a pause icon Automation paused — and next to it the switch that toggles it. The same state as the Automation column in the list, see automation switch. It sits beside the title because Start run stays available while automation is paused — a manually started run bypasses the pause. The switch is visible but disabled without the Full permission level. |
| Subline | Direction · Type · Connection, e.g. "Export · Processing · Cambira B2B-Shop". |
Actions
The header offers two actions:
- Start run — immediately starts a run of the route, independent of the automation switch and the configured trigger. Appears only for routes with a data scope of their own: those that scan their source, and those that drain a queue. A route that only reacts to events or to a dispatch input has nothing to start — the action is absent there.
- Transfer individually — transfers specific records, named by their business key or pasted in as a source record — even while the route's automation is paused.
Both actions require the Service Layer to be reachable. If it is not, the buttons stay visible; clicking one opens no dialog but reports "Service Layer currently not reachable".
Start run
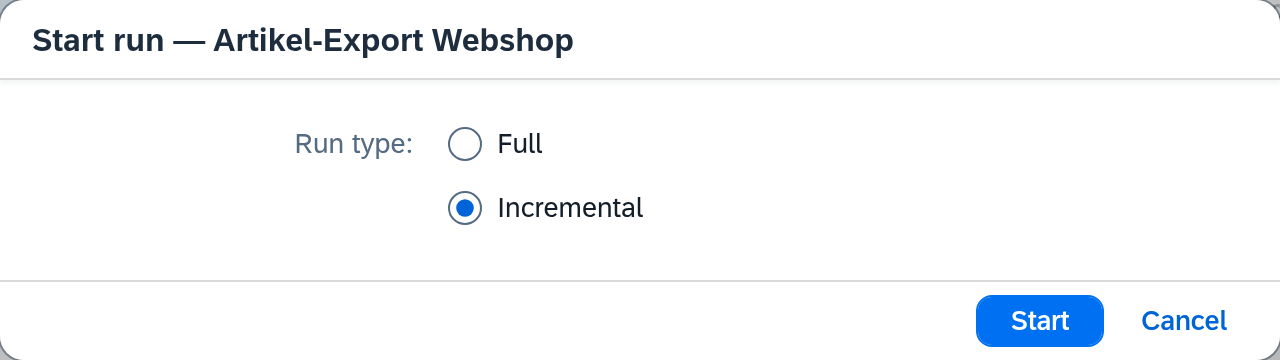
Opens a dialog that asks as much as the route leaves open. Where only a single run type remains, the choice is dropped and the dialog asks for confirmation instead:
| Route | Dialog |
|---|---|
| Scans its source and has a change filter | Run type choice: Full processes the route's entire data set, Incremental only the changes since the last run. The dialog opens on Incremental; Full is a deliberate choice. |
| Scans its source, without a change filter | No choice — only Full is possible. The dialog asks "Start a full run for this route now?". |
| Drains a queue | No choice — the dialog asks "Empty the queue for this route now?" and offers the Maximum records field. |
Depending on the route, two further fields appear:
| Field | Content |
|---|---|
| Maximum records | Only for routes that drain a queue. Limits how many entries this run collects. Prefilled with the limit of the matching scheduled trigger where one has it; if the field stays empty, the run collects the whole queue (placeholder "empty = whole queue"). |
| Cleanup | Checkbox "Report records outside the data filter". Only with run type Full, and only for routes whose delete behaviour reports such records — otherwise the checkbox does not appear. When it is set, records that no longer match the data filter are reported to the target system. The choice applies to the started run only; it changes nothing on the scheduled trigger. |
Confirm with Start, discard with Cancel. If the run cannot start, the dialog stays open and a brief message states the reason:
| Message | Cause |
|---|---|
| A run for this route is already requested | A run for the route is already running or waiting. |
| The system is not ready for new runs yet | Xchange has started but is not operational yet — see System status. |
| The route's connection is paused | The route's connection is paused or blocked. |
| The license is not valid — new runs are blocked | The license does not admit new runs. |
| An incremental run needs a change filter on the route | The route's change filter disappeared between the dialog opening and the start. |
| This route only reacts to events — there is no data scope to run | The route no longer has a data scope of its own since the detail view was loaded. |
Transfer individually
Opens a dialog with one of two input fields. Which one appears depends on whether the route's source can fetch individual records by key: with direction Export the source is SAP Business One and can do so; with direction Import keyed fetching is not implemented yet — the record is pasted in directly instead.
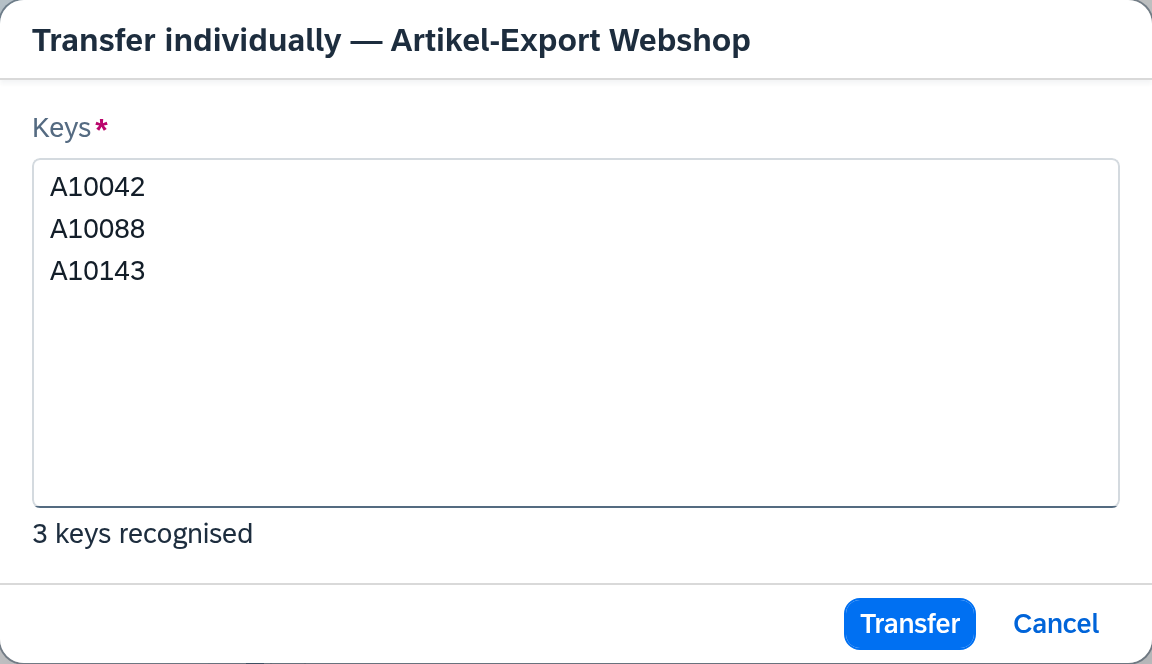
| Field | Content |
|---|---|
| Keys | With direction Export. Multi-line text field, one business key per line (e.g. A00001). Required. Directly below, a counter shows the number of recognised keys; duplicate lines are removed automatically and called out as a hint. More than 100 keys per transfer are not allowed — an error message states the limit, and the current count stays in the counter above. |
| Source record (JSON) | With direction Import. JSON editor with line numbers for exactly one source record. Required. Xchange fetches nothing here; it processes the pasted record as it stands. If the content is not valid JSON — or empty — the message "The payload is not valid JSON" appears and the transfer does not start. |
Confirm with Transfer or Cancel; in the Keys field, Ctrl+Enter confirms as well. Without at least one recognised key, or with more than 100 keys, a message appears and the transfer does not start.
If the transfer fails, the dialog shows an error message — depending on the cause, e.g. "The route was not found.", "No connection to the service." or "The service is currently unavailable."; if the license is not valid, it reads "The license is not valid. New transfers are blocked." A collapsible Technical details section additionally shows the technical error cause, except for an invalid license.
Feedback after starting
Both a manually started run and a transfer open the same confirmation after a successful start: "Run started" with the new run's reference. The Open in history action jumps straight to History, filtered to this run; Close dismisses the confirmation.
Operational information
Below the header, the Operational information panel summarises where the route currently stands. What is happening right now comes first — the Currently running row, whenever a run is in flight. Next execution follows as the first row that is always there; the remaining ones appear only when they have something to say.
| Row | Content |
|---|---|
| Currently running | Every run of the route that is in flight — one row per run, because a route legitimately has several at once. Each names the run type, status, start time and the elapsed time ("running for 4 min"), which keeps counting on screen. Below it stands a progress bar as soon as the first jobs exist; the bar states the figures itself — "12 of 340 jobs". Xchange already works through the jobs while it is still reading the data set, so the second figure grows at first — which is what lets you watch from the start. While not a single job exists yet, "Determining data…" stands in its place. The Show in History link closes the row and filters History to this run. Where nothing is running, the row is omitted. |
| Next execution | Timestamp of the next automatic execution. While automation is paused, the timestamp is stated in the subjunctive — "Would be 29.08.2026 14:00"; the state itself is named in the header, so the row does not repeat it. Where no timestamp stands, the row names the reason — see No timestamp below. |
| Automatic pause reason | Only when the runtime, rather than a person, paused the automation — with the reason in plain words. |
| Incoming events | Only for routes with an event trigger, and only while events are waiting unprocessed: how many events are waiting, how long the oldest of them has been waiting, and the reason processing is not proceeding — Connection paused, Retrying or Processing stalled. Paused automation is not named here, the header shows it; the row then stays with the count and disappears when it has nothing else to say. The waiting time keeps counting on screen. From four hours on the backlog counts as overdue and the row is tinted as a warning. |
| Last error | The route's newest open clarification case: its status, the time of the failure and the message. A failure Xchange is still retrying has not opened a case yet and does not appear here; a resolved or dismissed case leaves the row immediately. The View clarification case link leads to Manual clarification. |
| Next incremental run | Only for routes that can run incrementally: what the next such run does with the stored position. Where the source keeps change dates itself — as with a change filter — the row names the date from which it reads; that date is deliberately one day before the last run because SAP Business One records change dates to the day only. Where the source keeps the position itself and returns it as an opaque value, there is no such date — the row then names the time at which the position was stored. Where no position is stored yet, the next run processes the full scope. |
Where the route's runs cannot be read, the notice "The runs could not be read." stands above the panel. The remaining rows are unaffected — the notice tells this case apart from a route that has simply never run.
No timestamp
Where no next execution can be named, the Next execution row states the reason. If automation is paused and no timestamp can be derived, it simply reads "No automatic execution"; otherwise it follows the route's triggers:
| Route | Text |
|---|---|
| Has a scheduled trigger that yields no next timestamp | "A time-based trigger exists but no next execution can be derived. Check the schedule." — the schedule has run out or is set so that it no longer takes effect. |
| Is triggered by a SAP event | "No time-based trigger — the route is triggered by an event." |
| Is supplied through a dispatch input | "No time-based trigger — the route is triggered through a dispatch input." |
| Has no automatic trigger at all | "No time-based trigger — the route runs only manually." |
Run type
The run type comes first — at the start of the line under Currently running, in the first column under Recent runs — because it says what the outcome behind it refers to: "Partially succeeded" means something different for a full run than for a cleanup. The same wording appears in the operation details.
| Run type | Meaning |
|---|---|
| Full | The run read the route's entire data set. |
| Incremental | The run read only the changes since the last run. |
| Drain queue | The run collected and processed the entries waiting in an external queue. |
| Event | The run worked off the events accumulated from SAP Business One without rescanning the source. |
| Dispatch inbox | The run processed one record that a dispatch route handed on to this route. |
| Targeted | The run processed exactly the records it was given — through Transfer individually or through Reprocess in History. |
| Cleanup | The run reported for a preceding run which records lie outside the data filter, see Cleanup after a run. |
Composition of the run
What a run was made of stands below its line while it is running, and in the Jobs column once it is over — the number of its operations and, separated by commas, how they turned out: "40 jobs: 2 awaiting clarification, 38 skipped". Only categories with at least one operation are named, and only where there are at least two of them; where the whole run falls into a single category, only the total stands there — the outcome in the line above already says it. The order is fixed rather than sorted by size, and starts with what needs a decision:
| Category | Meaning |
|---|---|
| awaiting clarification | The operation failed permanently and is waiting in Manual clarification. |
| in conflict | The record was changed in the target system in parallel. |
| blocked | The operation could not start because a precondition was missing. |
| for review | The operation was routed out for a business review. |
| succeeded | The operation was transmitted. |
| skipped | There was nothing to do on the record. |
| cancelled | The operation was cancelled before it was processed. |
| dismissed | The operation was discarded without being transmitted. |
While the run is still going, the progress bar carries these figures — "12 of 340 jobs" — and the composition is omitted: the same two numbers a second time below it would suggest a difference that is not there. While not a single job exists yet, there is no bar and the row reports "Determining data…". After that the bar appears immediately, even while the data set is still being read: Xchange works through the first jobs as it creates further ones, so the stated target still grows at first — and for some runs, draining a queue for example, right to the end. A completed run without a single operation reports "No jobs".
Cleanup after a run
When a route reports records outside the data filter (see Delete behaviour), that does not happen in the full run itself but in a separate run that follows immediately, with the run type Cleanup. This keeps it visible which operations came out of the data-set comparison and which came out of the cleanup.
The two runs know each other. In the operation details, the Cleanup for run row leads from the cleanup back to the run that triggered it, and the Cleanup row leads from the triggering run to its cleanup. If the cleanup was suspended, it has no operations — the Cleanup row then reads Suspended instead of a link.
Suspended cleanup
If a cleanup would report a conspicuously large share of the transmitted records as outside the data filter, Xchange does not carry it out. A notice then appears above the operational information — e.g. "Cleanup suspended — 412 of 1,038 transmitted records no longer match the data filter." The run ends without a single one of those records transmitted; the route's automation stays switched on.
The halt guards against the case where a changed data filter or an incompletely answering source fakes a large share of the data set having dropped out. Compare the two numbers against what you expect, then choose Decide in the notice. The dialog restates both numbers and offers you two answers:
- Release transmits the reports after all. If this route has only just started cleaning up, that includes every record that stopped matching the data filter earlier. The report marks the record as deleted; what the target system makes of that is its own decision. Xchange does not take the report back: the records are transmitted again only once they match the data filter and a run picks them up.
- Discard records that the cleanup is not carried out this time: the notice disappears, nothing goes to the target system. The next full run with cleanup determines the records anew — a suspended run is never replayed, it is always recalculated. Once the data filter fits again, the notice disappears by itself.
- Cancel, or close the dialog. The notice stays until one of the two paths is taken.
Without the Full permission level the notice appears, but not the link inside it.
Per-operation time limit
A single operation may run for a set time at most — ten minutes by default. Past that, Xchange stops the operation and files it under Manual clarification rather than retrying it. The reason shown there: the deadline was exceeded and whether the target system received the data is unknown. Check the target system before reprocessing — a blind second attempt could create a document twice.
Key figures
Below that, the Key figures panel shows the route's measurements as tiles. Backlog and Open clarifications state the current situation, the other three the last 24 hours; their trend arrow compares against the 24 hours before that.
| Tile | Content |
|---|---|
| Open clarifications | Operations of this route awaiting a decision in Manual clarification. Clicking opens the clarification list filtered to this route. |
| Backlog | Operations waiting to be processed. |
| Error rate | Share of permanently failed operations, in percent. Only settled operations are counted, so a run in flight does not dilute the rate. |
| Runtime per operation | The runtime 95% of operations stayed below; the Maximum side figure names the slowest. Below 20 operations the 95% value says nothing — the tile then shows the maximum and states so in its subtitle. |
| Operations | Number of operations in the period. |
If the route processed nothing in the last 24 hours, the three period tiles are omitted and the panel states it with the sentence "No jobs in the last 24 hours." Backlog and Open clarifications then only stay where they have something to report — at zero they are omitted as well. Where the number of open clarifications cannot be determined, the tile is absent entirely rather than showing a zero that was never read.
Recent runs
At the very bottom, the Recent runs panel lists the route's last five completed runs, newest first — as a table of five columns: run type, outcome, started, duration and jobs (the run's composition). That lets the runs be compared against each other, which the stacked lines under Currently running cannot do; there is no progress bar here, because the runs are over. Pressing a row opens History, filtered to that run. On narrow screens, started, duration and jobs move below the row.
Five runs of every type are listed, unfiltered. Whoever is looking for something specific belongs in History: that is where the filters are. Where the route has never run, the panel is omitted.