Overview
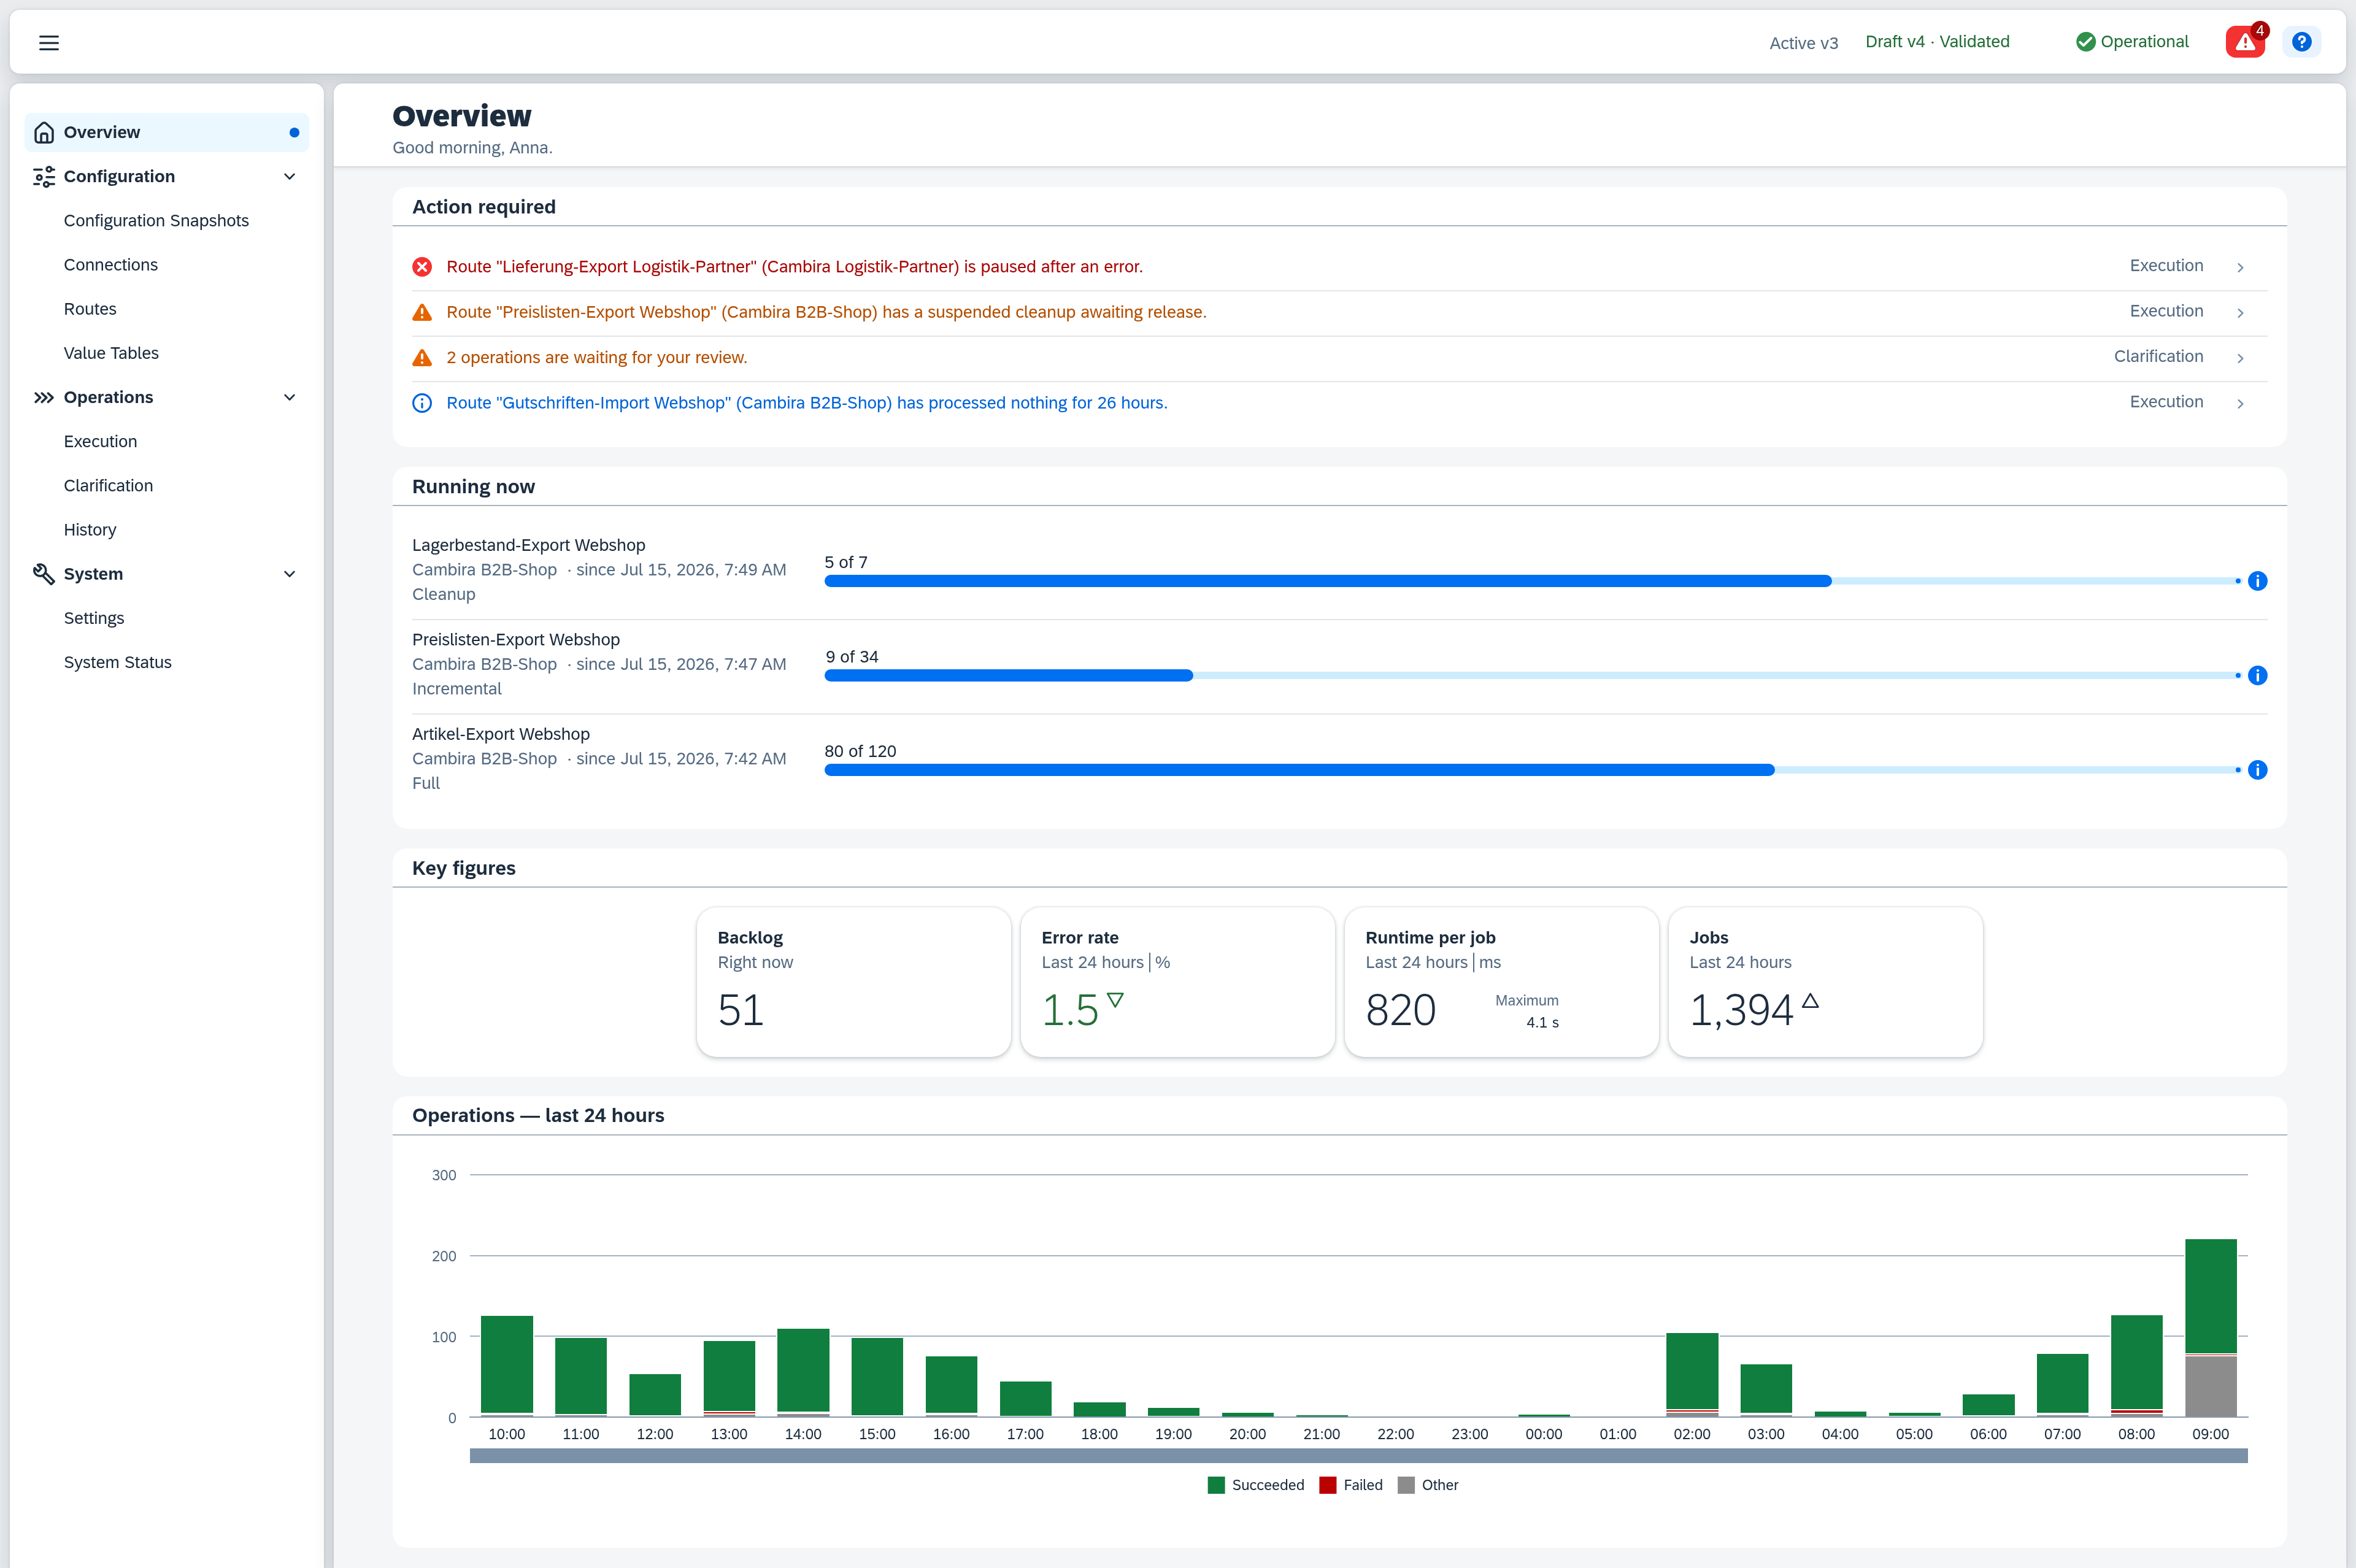
The Overview is the start page of Xchange and answers two questions: is there anything to do right now, and how is the system running? The display updates itself; reloading the page is not necessary.
Permissions
The page itself is visible to all users, but its content only with the matching read permission. The first three permissions decide which rows the Action required list holds for you; the fourth unlocks the sections below it:
| Permission | Shows you |
|---|---|
| Operations — Clarification | the row about open clarifications |
| Configuration — Connections | the row about blocked connections |
| Configuration — Routes | the rows about an individual route |
| Operations — History | Running now, Key figures, and Operations — last 24 hours |
The four system status rows — Processing stopped, Database change detected, Xchange unreachable and Maintenance mode active — need no permission: they concern the whole application and are therefore shown to everyone.
If one of the four permissions is missing, Nothing to clarify only says that nothing is open within your own view of the system.
Overall status
Next to the greeting sits Nothing to clarify (green) as long as nothing is open; the Action required list is then absent entirely. As soon as something is open, that message goes and the list appears.
Action required
Every row of the list is one open item; clicking it takes you to where you handle it.
The same list also sits in the header and is therefore reachable from every screen: while something is open, a bell icon appears there carrying the number of open items, coloured after the most severe among them. Clicking it opens the list, and the rows lead to the same places as here. With nothing open, the icon is absent.
| Row | Meaning | Colour | Leads to |
|---|---|---|---|
| Processing has stopped — reason. | Xchange has halted processing; the reason is part of the row. | Red | System Status |
| Database change detected — a reset is required. | Xchange is working against a different database than before and must be reset. | Red | System Status |
| Xchange is unreachable. | The service is not responding. | Red | System Status |
| Maintenance mode is active — processing is paused. | Processing is paused deliberately. | Orange | System Status |
| N connections are blocked after an access failure. | The sign-in was rejected; processing over these connections is paused. Check the credentials and start a connection test — the block lifts as soon as it succeeds again. | Red | Connections |
| Route "name" is paused after an error. | Xchange paused this route's automation after an error. The reason in plain words and the last error are in the route's Operational information. Once the cause is fixed, you switch the automation back on there. | Red | Execution, the route's detail |
| Route "name" has a suspended cleanup awaiting release. | An unusual number of transferred records no longer match the data filter and would be reported to the target system as deletions. Xchange holds them back until you release or discard the cleanup — or the next run finds fewer of them. | Orange | Execution, the route's detail |
| N operations are waiting for your review. | Operations that could not be completed automatically. The row goes once you have decided on each of them. | Orange | Clarification |
| Route "name" has processed nothing for period. | The route has been quiet longer than its schedule suggests — that can mean the route's trigger is no longer starting runs, but equally that the source system had nothing to send. This row goes on its own as soon as the route processes something again. | Blue | Execution, the route's detail |
No row is ticked off or dismissed — each disappears once its cause is gone. The four rows about the system state only go once somebody steps in at System Status.
Running now
Below Action required sits the Running now panel, for as long as runs are in flight — one row per run with the route, the connection, when it started ("· since Jul 15, 2026, 9:42 AM"), the run type, and a progress bar showing the settled operations ("80 of 120"). The most recently started run is at the top. Clicking opens the History narrowed to that run. With nothing in flight, the panel is absent.
What the bars leave open reappears further down under Key figures as the Backlog — without the operations being processed right now.
Key figures
The Key figures panel shows the measurements of the whole system as tiles. The backlog still to be worked off comes first, then the look back over the last 24 hours. Under each figure is what it refers to — "Right now" for the backlog, "Last 24 hours" for the rest.
| Tile | Refers to | Content |
|---|---|---|
| Backlog | Right now | Operations waiting to be processed. What is being processed right now is not counted — which is why the figure stays below the open operations of the runs in flight. |
| Error rate | Last 24 hours | Share of permanently failed operations, in percent, measured against the succeeded and the permanently failed ones together. Skipped, cancelled and still running operations stay out of it. |
| Runtime per operation | Last 24 hours | 95% of operations were faster than this value; the Maximum side figure names the slowest. |
| Operations | Last 24 hours | Total number of operations — regardless of status. |
The three period tiles carry a trend arrow comparing against the 24 hours before that — provided the value moved appreciably and the earlier period offers something to compare with; otherwise the tile stays without an arrow. It is coloured only where a direction means something: on Error rate and Runtime per operation the figure turns orange when the value has risen and green when it has fallen. Operations stays neutral. Backlog carries neither arrow nor colour.
Where the period held fewer than 20 processed operations, and thus too few for a dependable 95% figure, Runtime per operation names the slowest operation instead; the subtitle then reads "Last 24 hours, maximum" and the side figure is absent.
If the system processed nothing in the last 24 hours, the three period tiles are omitted and the panel states it with the sentence "No operations in the last 24 hours." Backlog stays as long as something is waiting.
Operations — last 24 hours
At the bottom, a column chart shows throughput per hour, split into Succeeded, Failed, and Other — the last being operations that neither succeeded nor failed permanently: skipped, cancelled and dismissed ones as well as those still in flight. Each column is labelled with the hour it counts from: "09:00" stands for 09:00 to 10:00. Hover a column to read that hour's figures in the tooltip.
Clicking a column opens the History narrowed to that hour — the short path from a red spike to the operations behind it.
If the system processed nothing in the last 24 hours, the chart is omitted and the same sentence as under the key figures takes its place. With no route set up at all, the panel is absent entirely.